
As a data analyst, numbers are your constant companions. Yet, not all numbers behave the same way, and treating them correctly can mean the difference between actionable insights and misleading results. Two of the most fundamental types of numerical data are discrete data and continuous data.
Understanding the discrete vs. continuous data is critical for effective data analysis, ensuring accurate visualizations, and making informed decisions in any field, whether it’s statistics, machine learning, or business intelligence.
In simple terms:
- Discrete data are countable values, like the number of items sold or the number of customers visiting a store.
- Continuous data are measurable values, such as the weight of those items, the revenue generated by the store, or the time taken to complete a task.
This guide will help you understand, identify, and apply these data types effectively, with actionable examples, insights, visualisations and practical use cases to understand discrete and continuous data better.
What is Discrete Data?
Discrete data consists of distinct, separate values that are countable. These values are finite, with no intermediate points between them.
For example, the number of products in stock or the outcomes of a die roll are discrete data points. This type of data is common in datasets involving counts or events.
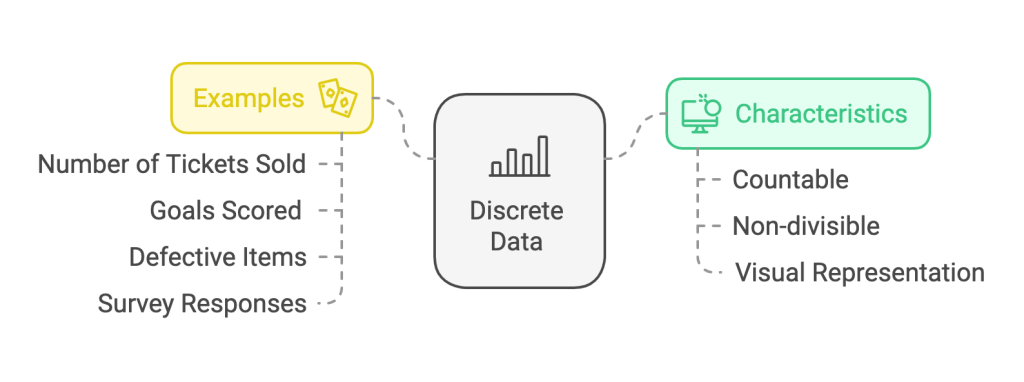
Characteristics of Discrete Data
- Countable: Values can be listed or enumerated as whole numbers.
- Non-divisible: Intermediate values, such as 2.5, do not exist.
- Visual Representation: Best visualized using bar charts, pie charts, or frequency tables.
Examples of Discrete Data
- The number of tickets sold for an event.
- Goals scored in a sports match.
- Defective items in a production batch.
- Survey responses, such as the count of individuals selecting each option.
Example: Tracking Sales Metrics
| Product | Units Sold |
|---|---|
| Product A | 150 |
| Product B | 120 |
| Product C | 80 |
Here, the units sold are discrete because they are whole, countable numbers. Discrete data often play a pivotal role in inventory management and supply chain analysis, where tracking counts is essential for operational efficiency.
Analytical Tips for Discrete Data
- Use frequencies, proportions, or distributions to analyze discrete datasets effectively.
- Employ statistical techniques like chi-square tests or frequency analyses for categorical data insights.
Advanced Applications
Discrete data plays a vital role in predictive modeling and machine learning. For example:
- Decision Trees: Discrete variables define categorical splits for classification models.
- Time Series Analysis: Discrete data, such as daily customer counts, can be used to predict trends or seasonality.
- Anomaly Detection: Discrete metrics like transaction counts can highlight unusual patterns or fraud indicators.
What Is Continuous Data?

Continuous data represents measurable values that can take any point within a range, allowing for infinite precision.
Examples include physical measurements, financial metrics, and scientific observations. Continuous data provides the granularity needed for high-precision analyses.
Characteristics of Continuous Data
- Measurable: Requires tools like scales, stopwatches, or thermometers.
- Infinite Possibilities: Values can include decimals or fractions.
- Visual Representation: Best suited for histograms, scatter plots, or line graphs.
Examples of Continuous Data
- The duration of customer service calls.
- The weight of items in a shipment.
- Daily temperature changes in a city.
- Continuous performance metrics like revenue growth rates.
Example: Monitoring Environmental Data
| Day | Temperature (°C) |
|---|---|
| Monday | 22.4 |
| Tuesday | 25.6 |
| Wednesday | 24.8 |
In this case, temperature is continuous because it allows for fractional values. Continuous data also plays a crucial role in climate modeling and environmental monitoring.
Analytical Tips for Continuous Data
- Apply regression analysis to model relationships between variables.
- Use variance and standard deviation to understand data dispersion.
Advanced Applications
Continuous data underpins advanced techniques like:
- Optimization Algorithms: For instance, minimizing production costs or optimizing delivery routes.
- Time-Series Forecasting: Predicting trends in stock prices or weather patterns using models like ARIMA or LSTMs.
- Quality Control: Monitoring product weights or dimensions ensures adherence to specifications in manufacturing.
- Simulation Modeling: Continuous data drives simulations for resource planning or risk assessments.
Core Differences Between Discrete and Continuous Data
Let’s start with the basics.
Discrete data and continuous data differ in their characteristics, levels of precision, and how they’re analyzed or visualized.

Recognizing these differences is essential for selecting appropriate statistical and computational methods.
| Feature | Discrete Data | Continuous Data |
|---|---|---|
| Definition | Countable, distinct values | Measurable, infinite within a range |
| Examples | Number of cars, goals scored | Weight, height, temperature |
| Granularity | Whole numbers only | Fractions and decimals allowed |
| Visualization | Bar charts, pie charts | Histograms, scatter plots, line graphs |
Discrete variables often represent categorical or finite datasets like survey responses, customer counts, or inventory levels while continuous variables dominate fields requiring precision, such as physics, financial modeling, or healthcare metrics.
These distinctions affect everything from A/B testing to predictive modeling, underscoring their importance in effective decision-making.
Misclassification of these types can lead to analytical errors and misinformed insights, significantly impacting business outcomes.
Why Does Discrete and Continuous Data Matter?
Understanding the distinction between discrete vs continuous data is a cornerstone of data science and practical analysis.
Imagine this scenario: you’re analyzing sales performance.
If you mix up the number of products sold (discrete) with their total revenue (continuous), your analysis might mislead decision-makers, resulting in flawed strategies and wasted resources. Misinterpreting these fundamental data types often results in:
- Statistical Errors: Applying incorrect methods can lead to invalid conclusions.
- Poor Visualization: Misaligned graphs or charts confuse stakeholders and obscure trends.
- Faulty Decisions: Misguided insights, influenced by data misclassification, can be costly for businesses.
Understanding the type of data ensures that:
- Appropriate statistical techniques are applied.
- Visualizations effectively communicate trends and findings.
- Insights are actionable and reliable.
How to Identify Discrete and Continuous Data
Identifying whether data is discrete or continuous is fundamental to avoiding analytical errors. Misclassification can lead to poor visualizations, incorrect statistical models, and invalid results. A structured approach can help you classify data with confidence.
Practical Checklist for Identification
- Can you count or measure it?
- Countable (e.g., customers, items) = Discrete.
- Measurable (e.g., height, time) = Continuous.
- Does it include fractions or decimals?
- No (whole numbers only) = Discrete.
- Yes (fractions allowed) = Continuous.
- Can it be infinitely subdivided?
- No = Discrete.
- Yes = Continuous.
Examples Questions and Answers
- How many employees work in your company? Discrete, because the number is countable.
- What is the revenue generated in the last quarter? Continuous, because it includes decimals and can vary infinitely within a range.
- How long does a delivery take? Continuous, as time can be measured precisely down to fractions of a second.
Where to Use Discrete and Continuous Data
Discrete Data Applications
- E-commerce: Tracking daily orders or website visits.
- Social Media: Tracking engagement data.
- Education: Counting students or completed assignments.
- Healthcare: Monitoring patient admissions.
- Sports: Recording match statistics like fouls or points.
- Elections: Counting votes across constituencies.
Continuous Data Applications
- Finance: Measuring stock price fluctuations.
- Science: Tracking experimental data such as temperature changes.
- Manufacturing: Monitoring product weights and dimensions.
- Healthcare: Analyzing vital statistics like heart rate or blood pressure.
- Logistics: Monitoring real-time delivery times or distances.
Visualization Techniques for Discrete vs Continuous Data
Visualizing Discrete Data
Use:
- Bar charts
- Pie charts
- Frequency tables
Visualizing Continuous Data
Use:
- Histograms
- Line graphs
- Scatter plots
Combining Data Types
For mixed datasets, use interactive dashboards or heatmaps. For example, map sales categories (discrete) against revenue ranges (continuous) to uncover trends.
Combining visual elements like dual-axis charts can highlight relationships between discrete and continuous variables effectively.
Also Read: Synthetic Data in AI Modeling
Conclusion
Mastering discrete vs continuous data is foundational for accurate and insightful data analysis. These distinctions ensure effective visualizations, proper statistical methods, and reliable business insights. By applying these principles across diverse datasets, analysts can uncover trends, build predictive models, and drive data-informed decisions that deliver meaningful impact.
Understanding how to use discrete and continuous data transforms raw information into actionable insights, empowering you to make smarter, data-driven decisions in any field.